Urban Minorities Carry Largest Burden In Unemployment Saga
The Great Recession has caused millions of job losses across the country. Many families and communities are devastated. While every metropolitan area has experienced some negative economic consequences from the Great Recession, not all areas have suffered equally. Looking just at annual unemployment rates in 2009, we see wide variations of hardship in the 50 largest metropolitan areas. The unemployment rate in the Detroit metro area, for example, was more than two-and-a-half times the rate in Oklahoma City (see Table 1).
Since the start of the recession in December 2007, the United States has lost approximately 8 million jobs, while the available labor force has also grown by roughly 3 million workers. We therefore need a total of about 11 million more jobs to return us to where we were before the recession started (Shierholz 2010).
Until we fill the jobs hole, many communities will continue to suffer. High rates of unemployment cause immediate harm to families and communities, and they also cause long-term social and economic damage that cannot be easily fixed even when the economy finally recovers (Irons 2009).
This Issue Brief details the variation in unemployment across the 50 largest metropolitan areas. Its key findings are:
- In 2009, the national annual unemployment rate was 9.3%. Five of the 50 largest metropolitan areas had unemployment rates over 11.3%—2 percentage points above the national rate—while seven experienced rates that were less than 7.3%—2 percentage points below the national rate.
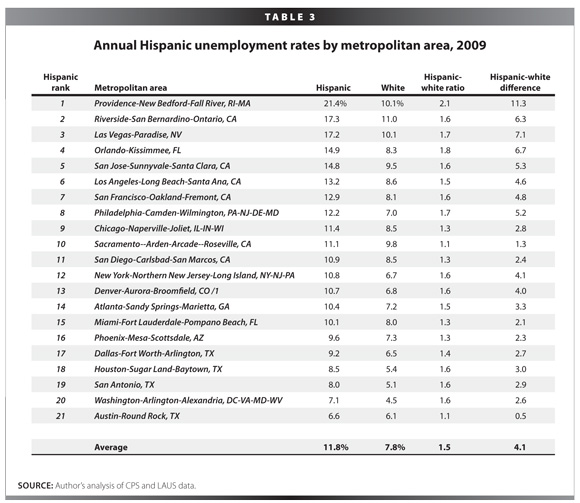
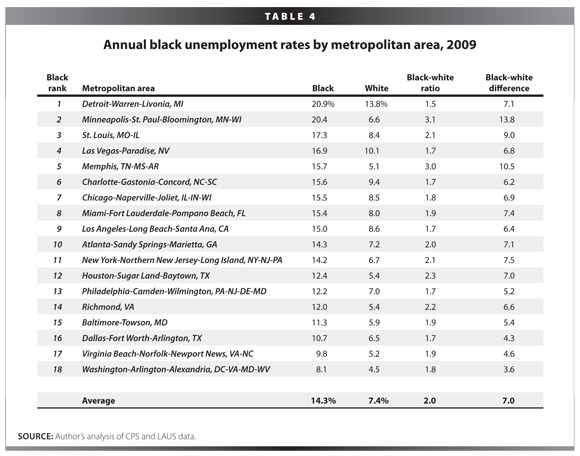
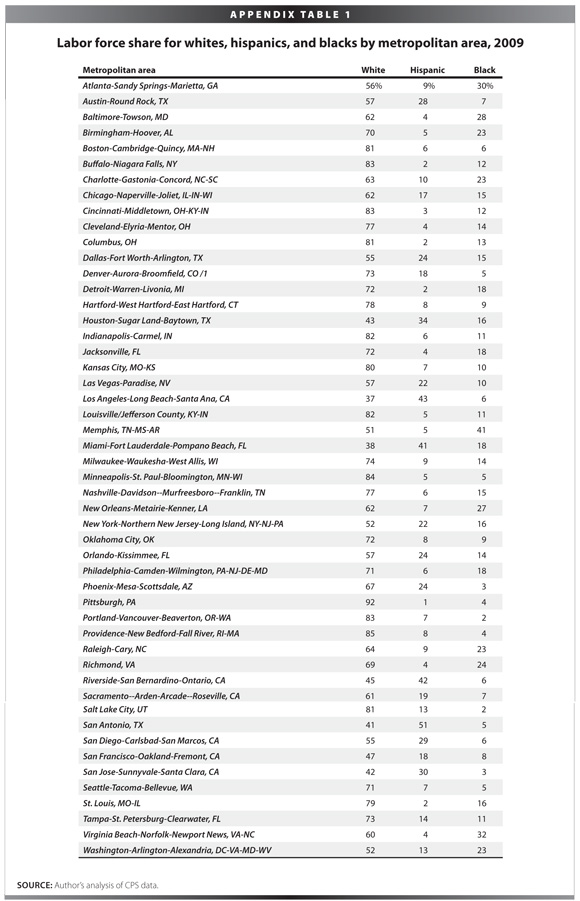
- Only one metro area had a white unemployment rate above 11.3% (Detroit, 13.8%). Nine metro areas had a Hispanic unemployment rate above 11.3%, and 14 had a black unemployment rate above that level.
- No metropolitan area had a black unemployment rate below 7.3%, and only two areas had Hispanic unemployment rates below 7.3%. Nearly half of the areas—24—had white unemployment rates below that level.
- In all but two metropolitan areas, the white unemployment rate was lower than the overall rate. For the 50 largest metropolitan areas, the average white unemployment rate is 0.8 times the overall rate.
- The Hispanic-white unemployment ratio was highest in Providence, R.I. In Providence the Hispanic unemployment rate was double the white rate, and the gap was 11.3 percentage points.
- The black-white unemployment ratio was highest in Minneapolis and Memphis. In these metropolitan areas, the black unemployment rate was three times the white rate.
- In many instances, disparities are visible in unemployment rates even when we compare racial subgroups with the same level of education. We need to ensure that nonwhites have equal employment opportunities in the labor market.
Unemployment by metropolitan area
Table 1 shows the 2009 annual unemployment rates for the 50 largest metropolitan areas1ranked from highest to lowest. In 2009, the annual unemployment rate for the entire nation was 9.3%. Eleven metropolitan areas were above 10.3%. Five metros had unemployment rates over 11.3%.
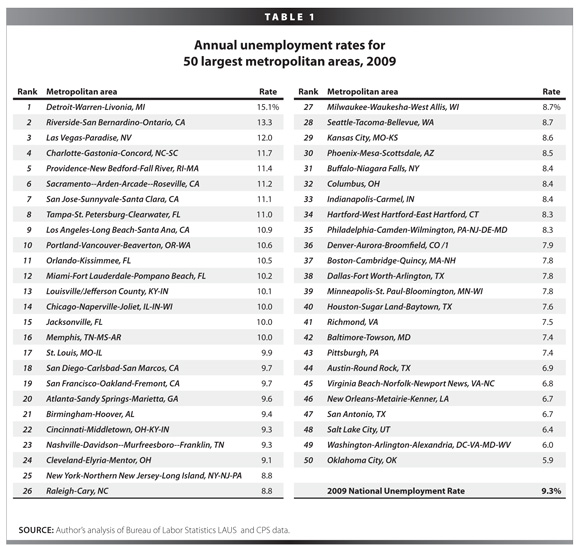
In 2009, the Detroit metro area experienced the highest unemployment rate of the 50 largest metros—15.1%—thanks in large part to the woes of its key industry, the auto industry. The industry’s sales collapsed under the triple load of high gas prices, a consumer credit crunch, and the recession. In descending order, the other metro areas with unemployment rates above 11.3% were Riverside, Calif., Las Vegas, Nev., Charlotte, N.C., and Providence, R.I.
While Detroit, Riverside, Las Vegas, Charlotte, and Providence suffered from very high unemployment rates, there were also metropolitan areas that had relatively low employment rates given the Great Recession. Fifteen metros had unemployment rates below 8.3%—1 percentage point below the overall national rate. Seven metro areas were below 7.3%.
The Oklahoma City and Washington D.C. metro areas were the least impacted by high unemployment in 2009. Oklahoma City had an unemployment rate of 5.9% and the D.C. metro area had a rate of 6.0%. Both of these areas have large public sectors. Oklahoma City has many government jobs because it is the state capitol, and it is also home to Tinker Air Force base and other large public-sector employers (Greater Oklahoma City Chamber 2010). The D.C. metro is, of course, the seat of the federal government. In both of these metro areas, the large amount of public-sector employment prevented the areas from experiencing larger rises in unemployment in 2009.
In 2009, while five of the largest metropolitan areas were facing the crisis of unemployment rates over 11.3%, seven were dealing with rates that were less than 7.3%. The unemployment rate in Detroit was more than two-and-a-half times the rate in Oklahoma City. While all unemployment rates above full employment are a reason for concern, dealing with an unemployment rate below 7.3% is certainly better than one above 11.3%.
Unemployment by metropolitan area and race
The Bureau of Labor Statistics (BLS) does not provide unemployment estimates for metropolitan areas by race. To create these estimates, we applied unemployment ratios derived from the Current Population Survey to the Local Area Unemployment Statistics (LAUS). The LAUS provides more accurate metro area unemployment rates, but it does not have data by race.
White unemployment in the 50 largest metropolitan areas basically follows the pattern for overall unemployment. Following the overall pattern, in 2009 the white metro unemployment rate was highest in Detroit (13.8%) and lowest in Oklahoma City (4.4%) (See Table 2).
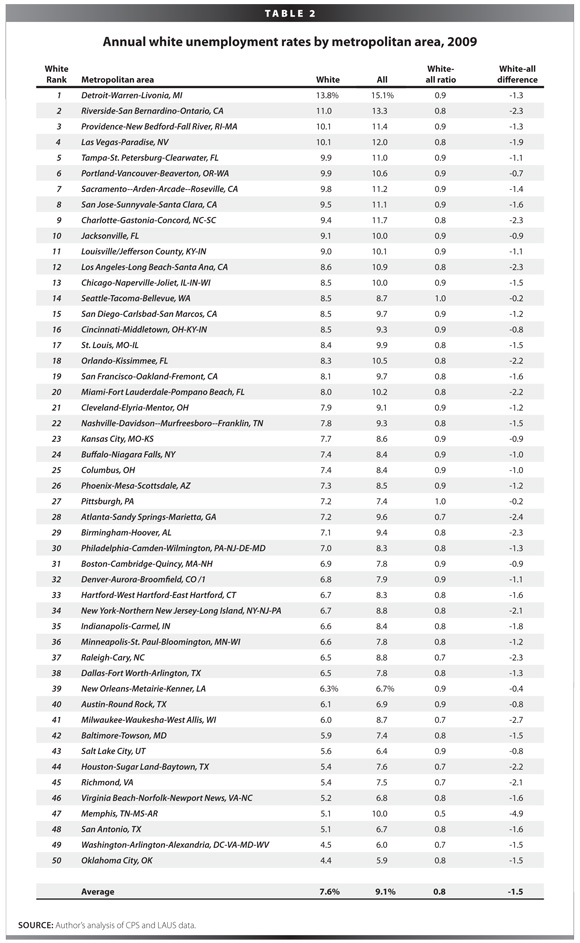
In all but two metro areas, however, the white unemployment rate was lower than the overall rate. In Memphis, the white unemployment rate (5.1%) was only half the overall rate (10.0%). In contrast, in Seattle and Pittsburgh the white unemployment rate was equal to the overall rate. For the 50 metropolitan areas, the average white unemployment rate is 0.8 times the overall rate. On average, the white unemployment rate was 1.5 percentage points below the overall rate.
Only in the Detroit metro area was the white unemployment rate—13.8%—more than 2 percentage points above the national rate. In nearly half of the metro areas—24—the white unemployment rate was less than 2 percentage points below the national rate.
Unfortunately, the sample sizes are not large enough to produce unemployment rate estimates for Hispanics and African Americans for all 50 metropolitan areas. Only 21 of the original 50 metropolitan areas are available to analyze for Hispanics. For African Americans, there are 18 available metropolitan areas to analyze.
Hispanic unemployment rates
Of the available metropolitan areas, the highest Hispanic metro unemployment rates were in Providence (21.4%), Riverside (17.3%), and Las Vegas (17.2%); the lowest were in Austin, Texas (6.6%) and Washington D.C. (7.1%) (see Table 3). In 2009, the Hispanic unemployment rate was above 11.3%—two percentage points above the national rate—in nine metro areas. In two metro areas, Austin and Washington D.C., the Hispanic unemployment rate was less than 7.3%.
Hispanics experienced nearly the same rate of unemployment as whites in Sacramento and Austin. In Providence, on the other hand, the Hispanic unemployment rate was double the white rate, and the gap was 11.3 percentage points. In terms of unemployment, Hispanics in Providence experienced the most hardship in both absolute and relative terms. On average, the Hispanic metro unemployment rate was 1.5 times the white rate and the Hispanic-white difference was 4.1 percentage points.
African American unemployment rates
The black unemployment rate in both the Detroit and Minneapolis metropolitan areas was just over 20% (see Table 4). These were the highest rates for blacks. Washington D.C. had the lowest black metro unemployment rate in 2009, 8.1%. Fourteen of the metro areas had black unemployment rates that exceeded 11.3%. None was less than 7.3%. By contrast, in 11 of the 18 metro areas analyzed for blacks, whites had unemployment rates below 7.3%.
The black-white unemployment ratio was highest in Minneapolis and Memphis. In these metropolitan areas, the black unemployment rate was three times the white rate. In both of these cities the black-white gap was also over 10 percentage points. The black-white ratio was lowest in Detroit, but blacks were still 1.5 times as likely to be unemployed as whites. On average, blacks were twice as likely to be unemployed as whites.
A tale of two metros: Minneapolis and Sacramento
It is beyond the scope of this Issue Brief to conduct a detailed examination of unemployment in each metropolitan area. It is useful, however, to point out that the racial and ethnic disparities documented here are not simply due to the lower educational attainment, on average, of Hispanics and African Americans.
Generally, the more educated a population, the lower their unemployment rate. As a result, many people assume that racial disparities in unemployment rates are due only to differences in educational attainment. A closer look at the Minneapolis and Sacramento metropolitan areas will show that the story of race and unemployment is more complicated.
The analysis thus far has been based on data from the Bureau of Labor Statistics’ Current Population Survey (CPS). Because of the sample size limitations of the CPS, we need to turn to the American Community Survey. The American Community Survey (ACS) is designed to provide statistics for relatively small populations (U.S. Census Bureau 2009). However, it also has limitations.2 The ACS has less stringent criteria for defining unemployment (U.S. Census Bureau 2009), the geographic definitions of metro areas differ somewhat from the CPS definitions, and its data are less current.Data from 2008 are the most recent available.
Due to the differences between the 2009 CPS data and the 2008 ACS data, the findings from these two datasets are not the same. However, the ACS analysis does shed light on the relationship of education to unemployment in Minneapolis and Sacramento.
Looking at the unemployment ratios with whites for Hispanics and African Americans in Tables 3 and 4, the Minneapolis metropolitan area stands out as having the worst relative disparity. The Minneapolis metropolitan area has a black-white unemployment ratio of 3.1 to 1. This means that blacks are 3.1 times as likely to be unemployed as whites. Additionally, the black-white difference in unemployment is almost 14 percentage points.
We can see that education is not the only explanation for the high relative unemployment rates of blacks by examining the unemployment rates for blacks and whites with similar levels of education in Minneapolis. In 2008 in the Minneapolis metro area, ACS data show that blacks with comparable levels of education as whites are much more likely to be unemployed. For example, African Americans with a high school diploma or GED were three times as likely to be unemployed as whites with the same level of education. Even if blacks had the exact same educational profile as whites in Minneapolis, they would still have a much higher unemployment rate (see also Austin 2008).
The Sacramento metropolitan area is an example of a labor market that works better for nonwhites. Sacramento had an unemployment rate of 11.2% in 2009, but the level of hardship was nearly equal between whites and Hispanics. The Hispanic unemployment rate was 11.1%, and the white unemployment rate was 9.8%, which yielded a Hispanic-white unemployment ratio of 1.1 to 1. The average Hispanic-white ratio was 1.5 to 1, and it reached as high as 2.1 (See Table 3).
Analyzing the ACS unemployment rates in Sacramento by education level also reveals relatively equal employment opportunity. The 2008 ACS data for Sacramento show a 1.0 to 1 ratio of Hispanic to white unemployment rates for workers with a high school diploma or GED. Thus, Hispanic high school graduates in Sacramento are no more likely to be unemployed than white high school graduates.
For Hispanics and African Americans, as for other groups, the more-educated are more likely to be employed. Thus, improving the educational profile of these groups can help reduce their unemployment rates. But in many instances, disparities are visible in unemployment rates even when we compare racial subgroups with the same level of education. We need to ensure that nonwhites have equal employment opportunities in the labor market.
The need for targeted job creation
The hardship of unemployment is not spread evenly across the country. The Detroit metropolitan area experienced more than two-and-a-half times the rate of unemployment as Oklahoma City. Five of the largest metro areas had unemployment rates over 11.3%, while seven had rates below 7.3%.
Hispanic and black communities in metropolitan areas generally experience greater hardship from unemployment than whites. Only one metro area had a white unemployment rate above 11.3%, while nine metro areas had a Hispanic unemployment rate above 11.3%, and 14 had a black unemployment rate above that level. We would advance the cause of equal opportunity in the country by finding ways to target job creation to the Hispanic neighborhoods in places like the Providence metropolitan area and the African American neighborhoods in places like the Minneapolis metropolitan area.3
The strong public sectors in the Oklahoma City and Washington D.C. metropolitan areas were able to shore up those local economies in 2009. Today, many state and local governments are facing large deficits caused by the recession and are cutting jobs, work hours, and services. Even as the private sector begins to recover from the recession, the public sector could continue to have job losses and thereby slow and weaken the economic recovery (Pollack 2009).
The American economy is in desperate need of three things: (1) more job creation as soon as possible, (2) job creation targeted to areas with high unemployment, and (3) job creation that can shore up state and local government. The Local Jobs for America Act, introduced by Rep. George Miller (D., Calif.) and co-sponsored by more than 150 of his colleagues, is an important step in the right direction. It would create 1 million jobs, target job creation to high unemployment areas, and provide aid directly to state and local governments (Kittredge 2010). Policy makers should embrace policies of this sort that will work strategically to restore the economic health of the country.
Endnotes
1. The 50 largest metropolitan areas are derived from the July 1, 2009 population estimate from the Census Bureau (see U.S. Census Bureau 2010).
2. An advantage of the ACS is that it tends to have a higher response rate than the CPS. For example, in 2004 the ACS response rate was 93.1% while the CPS response rate was 88.9% (see Lowenthal 2006, p. 3 and Schmitt and Baker 2006, p. 11). This difference would act to improve the accuracy of the ACS relative to the CPS.
3. DiversityData.org reports that in 2000 in the Providence metro area 64.5% of Hispanics would have needed to move for them to be evenly integrated in the metro area. Hispanics were more highly segregated than blacks. In the Minneapolis metro area 60.1% of blacks would need to move for complete residential integration.
References
Austin, Algernon. 2008. Understanding the black jobs crisis. The Daily Voice, August 1.
http://www.thedailyvoice.com/voice/2008/08/understanding-the-black-jobs-c-000951.php.
Greater Oklahoma City Chamber. 2010. “Major Employers of the Area.” Oklahoma City: Greater Oklahoma City Chamber.
http://www.okcchamber.com/page.asp?atomid=124.
Irons, John. 2009. “Economic Scarring: The Long-Term Impacts of the Recession.” EPI Briefing Paper #243. Washington D.C.: Economic Policy Institute.
http://www.epi.org/publications/entry/bp243/.
Kittredge, Betsy Miller. 2010. Local Jobs for America Act. EdLabor Journal, March 10. Washington D.C.: U.S. House of Representatives Committee on Education and Labor.
http://edlabor.house.gov/blog/2010/03/local-jobs-for-america-act.shtml.
Lowenthal, Terri Ann. American Community Survey: Evaluating Accuracy. Washington D.C.: Population Reference Bureau.
http://www.aecf.org/upload/publicationfiles/da3622h1266.pdf.
Pollack, Ethan. 2009. “Dire States: State and Local Budget Relief Needed to Prevent Job Losses and Ensure a Robust Recovery.” EPI Briefing Paper #252. Washington D.C.: Economic Policy Institute.
http://www.epi.org/publications/entry/bp252/.
Schmitt, John and Dean Baker. 2006. “The Impact of Undercounting in the Current Population Survey.” Washington D.C.: Center for Economic and Political Research.
http://www.cepr.net/documents/cps_declining_coverage_2006_08.pdf.
Shierholz, Heidi. 2010. “Large Jump in Private-Sector Jobs, But Unemployment Increases to 9.9%.” Jobs Picture, May 7. Washington D.C.: Economic Policy Institute.
http://www.epi.org/publications/entry/jobs_picture_20100507/.
U.S. Census Bureau. 2009. “Guidance on Differences in Employment and Unemployment Estimates from Different Sources.” Washington D.C.: U.S. Department of Commerce.
http://www.census.gov/hhes/www/laborfor/laborguidance092209.html.
U.S. Census Bureau. 2010. “Annual Estimates of the Population of Metropolitan and Micropolitan Statistical Areas: April 1, 2000 to July 1, 2009 (CBSA-EST2009-01).” Washington D.C.: U.S. Department of Commerce.
http://www.census.gov/popest/metro/CBSA-est2009-annual.html.
The Economic Policy Institute, a nonprofit Washington D.C. think tank, was created in 1986 to broaden the discussion about economic policy to include the interests of low- and middle-income workers. Today, with global competition expanding, wage inequality rising, and the methods and nature of work changing in fundamental ways, it is as crucial as ever that people who work for a living have a voice in the economic discourse.